Method and technical data
| Turbine | Latitude | Longitude |
|---|---|---|
| T1 | 47.2195975 | 4.7878681 |
| T2 | 47.2162968 | 4.7870183 |
| T3 | 47.2127586 | 4.7840462 |
| T4 | 47.2094972 | 4.7800528 |
| T5 | 47.2059413 | 4.7764599 |
| T6 | 47.2026039 | 4.7744735 |
| T7 | 47.199248 | 4.7725131 |
| T8 | 47.1960744 | 4.7698191 |
| T9 | 47.1972549 | 4.7525902 |
| T10 | 47.1940847 | 4.7532135 |
| T11 | 47.1911261 | 4.7541343 |
| T12 | 47.1879277 | 4.7542414 |
| T13 | 47.1851599 | 4.7562382 |
All the videos and images were made with the EnergyPlanner software. Using EnergyPlanner’s digital terrain model (DTM), we can show accurately how the turbines will look from any location.
EnergyPlanner is a digital platform used to plan, simulate, visualise and communicate renewable energy projects. It was created by a Dutch company, The Imagineers, which specialises in combining geographic information systems (GIS), photos, videos and 3D models to show the world “as it could be” once it has been transformed. The company has worked in this field for 23 years. The software uses 3D geospatial technology originally developed in the aerospace industry to visualise objects in space.
Here we combine the DTM with Google Street View panoramas to create photorealistic impressions like those produced by wind farm developers. These panoramas can be viewed at different angles of view, usually between 90 and 45 degrees.
Where Google Street View images are not available for a location, such as the gardens of a château, a historic monument, a panoramic viewpoint or a village that Street View does not cover, we created our own panoramas. To do this, we took a 360-degree photo with an ultra-wide “fisheye” lens offering a 90-degree field of view. We then used specialist software to stitch the images into a spherical panorama, which was uploaded to EnergyPlanner. A raw panorama can only be viewed correctly with dedicated software.
Digital surface model (DSM) simulations
EnergyPlanner can also bring a high-resolution digital surface model (DSM) into its 3D world. A DSM accurately models everything that stands above the ground: buildings, trees and so on.
Our simulations use a 1 m resolution DSM from the French national mapping agency (IGN, Institut National de l’Information Géographique). The DSM is calculated by correlating aerial photographs taken by the IGN. By comparing two images of the same area, with a large overlap but a slightly different angle, the height of points above the ground can be worked out by stereoscopy.
The turbines
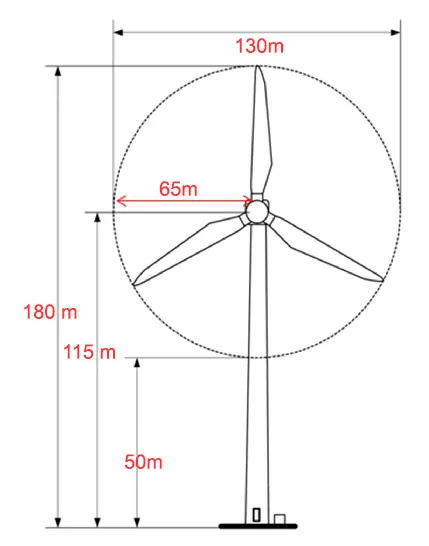
In its original application, Q ENERGY proposed turbines of up to 4.2 MW each. In all our photos and videos, the turbines have a hub height of 115 m and a rotor diameter of 130 m (65 m blades), giving a tip height of 180 m. These dimensions are similar to the 4.2 MW machines currently on the market: the Vestas V136-4.2 MW, for example, has a rotor diameter of 136 metres. Q ENERGY also states in its application that “. . . the blade length will be 65.5 m at most, leaving at least 49 m between the ground and the bottom of the blade.” (Projet Eolien de Grands Communaux demande d’autorisation environnementale – réponses aux demandes de compléments, p. 71; our translation).
Note, however, that the photosimulations commissioned by RES in support of the application show turbines with the same total height of 180 m but a rotor diameter of only 110 m (55 m blades). Since 65 m blades are 18 % longer than 55 m blades, the area they sweep is 40 % larger: 13,273 m² against 9,503 m² for 55 m blades. The swept area depends on the rotor radius (π × R²). This larger swept area has a significant effect on how visible a turbine is overall, especially once the movement of the blades is taken into account.
Aviation lighting
Our simulations show the “tower lights” installed 50 m up the tower, in addition to the lights that must be fitted on top of the nacelle.
Wind turbine lighting in France is currently governed by the order of 23 April 2018 on the marking of obstacles to air navigation (in French). It requires, among other things, white flashes of 20,000 candelas by day and red flashes of 2,000 candelas at night.
The regulations also state that turbines more than 150 m tall must have additional lights on the tower:
“For an onshore wind turbine with a total height of more than 150 metres, the medium-intensity lighting described above is supplemented by low-intensity type B obstacle lights (red, fixed, 32 cd) installed on the tower, operating day and night. One or more intermediate levels are required depending on the total height of the turbine, in accordance with the table below. Enough lights are installed at each level to make the tower visible from every direction (360°).” (our translation)
For turbines between 150 m and 200 m tall, the low-intensity type B lights must be installed at a height of 45 m (± 5 m).
Movement: an important factor not to overlook
Computer-generated photosimulations are accurate, realistic spatial visualisations of the proposed structures, superimposed on a photograph of the existing landscape. But they are still images, and cannot capture or convey movement properly. Yet movement is an integral part of human visual experience: our eyes are drawn to things moving in the landscape, such as clouds and vehicles, and to moving parts of a project, such as turbine blades.
Movement also makes objects in the landscape more visible and increases the visual contrast that people perceive. The movement of the blades is a very important part of the visual experience of a wind energy project.
What a photomontage shows A single frozen instant. The blades are still and the eye slides across the landscape.
What the eye sees on site The blades never stop turning. Movement is the first thing the eye picks up, even out of the corner of the eye, and it keeps coming back to it.
- One turn
- ≈ 6 s
- Blade tip
- ≈ 250 km/h
- Swept disc
- 13,273 m² ≈ 2 football pitches
Distance, lens, choice of viewpoint, light: the Understanding a photomontage page uses diagrams to explain what a still image shows, and what it doesn’t.
A digital simulation is not reality
When you look at photosimulations supplied by renewable energy developers, always remember that photographs are static, limited representations of one view, from one place, at one moment. The view is chosen by whoever made the simulation, not by the viewer, and so it directs your attention to what they want you to see, not to what you might choose to look at.